Integrating technology in a meaningful, balanced and intentional way is better achieved when the right opportunities arise from planning lessons and units. Strategically replacing assessment types, a topic constantly discussed by the curriculum expert Heidi Hayes Jacobs, is one way to pursue it.
One example is the expository writing piece that students in 5th grade were to recently engage in. Given that students had been involved in practicing research skills as part of their TPACK unit, which integrates Science and Literacy, our team decided we would take their findings to the next level by allowing them to explore new mediums, such as infographics. Thus, we co-planned and co-taught a set of lessons that led students through the process.
If you’re interested in an overview of how we approached the topic with the kids, please keep reading! Below are the steps we followed in order to prepare students and ensure an opportunity of ownership of the process.
Infographic Creation Process
Our timeline: We had six to eight forty-five minute sessions from introduction to published content in each of the five 5th grade classrooms at AES New Delhi.
First, students were engaged in a couple of lessons on Visual Literacy, what it is, how it supports their learning, when and where to apply it. The presentation graciously shared by Singapore American School educator Heather Dowd and slightly modified for our purposes served as a starting point for this stage. I split this lesson in two to give students an opportunity to gradually take in all the information.
Then, students learned about colors, fonts, shapes and the elements of design. They were given a chance to explore these, somewhat, new concepts (although many of them made connections to their Art class). On this day, students also learned about Creative Commons images and how to find materials that have been been licensed that way and give credit.
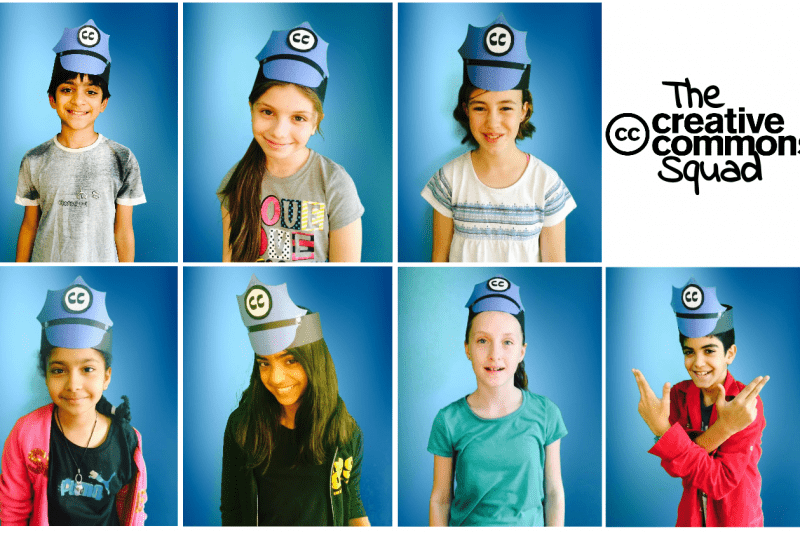
This part of the lesson was led by the incredible Creative Commons Squad, or a team of 5th graders that has been meeting with me during recess three or four times a week for about two months to learn and prepare presentations for their peers. It was a great opportunity for them to introduce their topic and model digital citizenship.

Next was the introduction of the Adobe Color tool (the iPad app and the web-based platform) and the Eye-dropper extension for browsers. We looked at some exemplars and observed how many of the colors used were handpicked from the images being exposed by the designers. Students were given time to explore picking out colors from the photos they had chosen to use, either taken by them at the Ranthambhore Tiger Reserve which we had just visited, or used with permission.
The following day was an intensive lesson on MacBook use. Since we run a 1:1 iPad program at AES Delhi, students had little or no experience with those machines and, thus, had to be brought up to speed with some ordinary commands, such as copying and pasting, taking screenshots, undoing, etc. On this day, we also learned how to use Preview and the Smart Lasso tool to crop objects off of photos.
Then it was time for us to explore the chosen tool to make infographics. In spite of the number of amazing choices out there, students were asked to use Google Drawing to build their layout. The simple reason behind this option was the fact that they could, had they wished to do so, go home and keep working at it at their own leisure without having to worry about compatibility issues. Google Drawing is accessible from any device, yet it runs smoother on desktop or laptop computers.
Students spent the remainder of time working on their products. We introduced the rubric and talked about some of our expectations in terms of the content and the design. For instance, students were required to cite their sources upon paraphrasing. As students worked, we circulated and provided feedback, often asking questions such as: Is there a reason why you have chosen to use the red color here? Do you notice how this box would make more sense grouped with that one? I see you have used a yellow background and are now using a light green font. What does that say about contrast? And so on.
This student’s reflection on all the required steps for the making of his infographic can also give you an idea of the scope of our work:[/vc_column_text][vc_video link=”https://www.youtube.com/watch?v=BCIxZmMI0Fk&t=135″][vc_column_text]As I reflect on it, I have to say I’ve never seen the children this engaged with a lesson before! They were owning every bit of their work as they explored their creative power. Now that the task is complete, they are publishing it on their blogs and writing reflections, many of which include the main point we wanted to get across: That, with design as with writing, one needs to have a purpose and work towards it, with a focus on their audience.
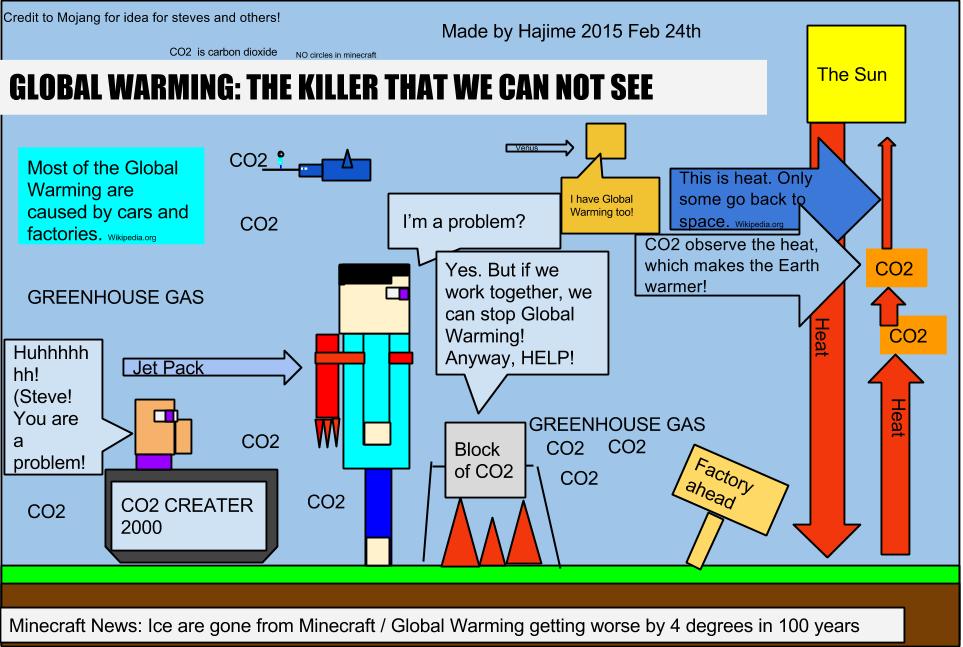
I hope you benefit from reading about the process we went through and this inspires you to pursue a creative path with your students as well! I remain available to answer any questions you might have. Before you go, please take a peak at some of the stunning infographics our students have created below.[/vc_column_text][vc_images_carousel images=”1112,1111,1110,1109,1108,1107″ img_size=”large” autoplay=”yes” css=”.vc_custom_1474985656231{margin-top: 5px !important;margin-right: 5px !important;margin-bottom: 5px !important;margin-left: 5px !important;}”]

